DataViz
Food Insecurity Among College Students
The final project that I will be exploring is food waste in the US specifically I will be exploring how there is so much food waste within the US and there are many countries with food insecurities. Most of this visualization will explore a subset of food food-insecure population not broadly talked about, College Students.
Food insecurity is a significant issue among college students, with prevalence rates ranging from 13% to 60% depending on the institution 1. The National Postsecondary Student Aid Study (NPSAS:20) provides a nationally representative dataset highlighting high levels of food insecurity and homelessness among marginalized students, including Black, Latina, Indigenous students, parenting students, and students with disabilities 1.
Food insecurity rates among college students are notably higher than those in the general population, with literature reviews reporting average prevalence rates of 33-51% compared to 9.8% among U.S. adults 2.
A study conducted in Texas in May 2020 found that 34.5% of respondents were food insecure within the last 30 days 3. The 2020 National Postsecondary Student Aid Study revealed that more than one in five undergraduates experience food insecurity 4.
Food insecurity among college students has been linked to lower graduation rates and lower chances of obtaining a bachelor’s or advanced degree 5. It also impacts academic performance, with 81% of students facing food or housing instability reporting that hunger harmed their academic performance 6
Available Datasets
Many open-source data sets address food waste and food insecurity globally and in the US as well as Food Insecurity within college campuses. These datasets will serve as a baseline on which the story of food waste and insecurity affects college students.
-
College Campus Food Insecurity
-
Food Insecurity in USA
-
Food Insecurity Global
-
Food Waste Globally
-
Other Resources Food: Material-Specific Data US EPA
An Outline
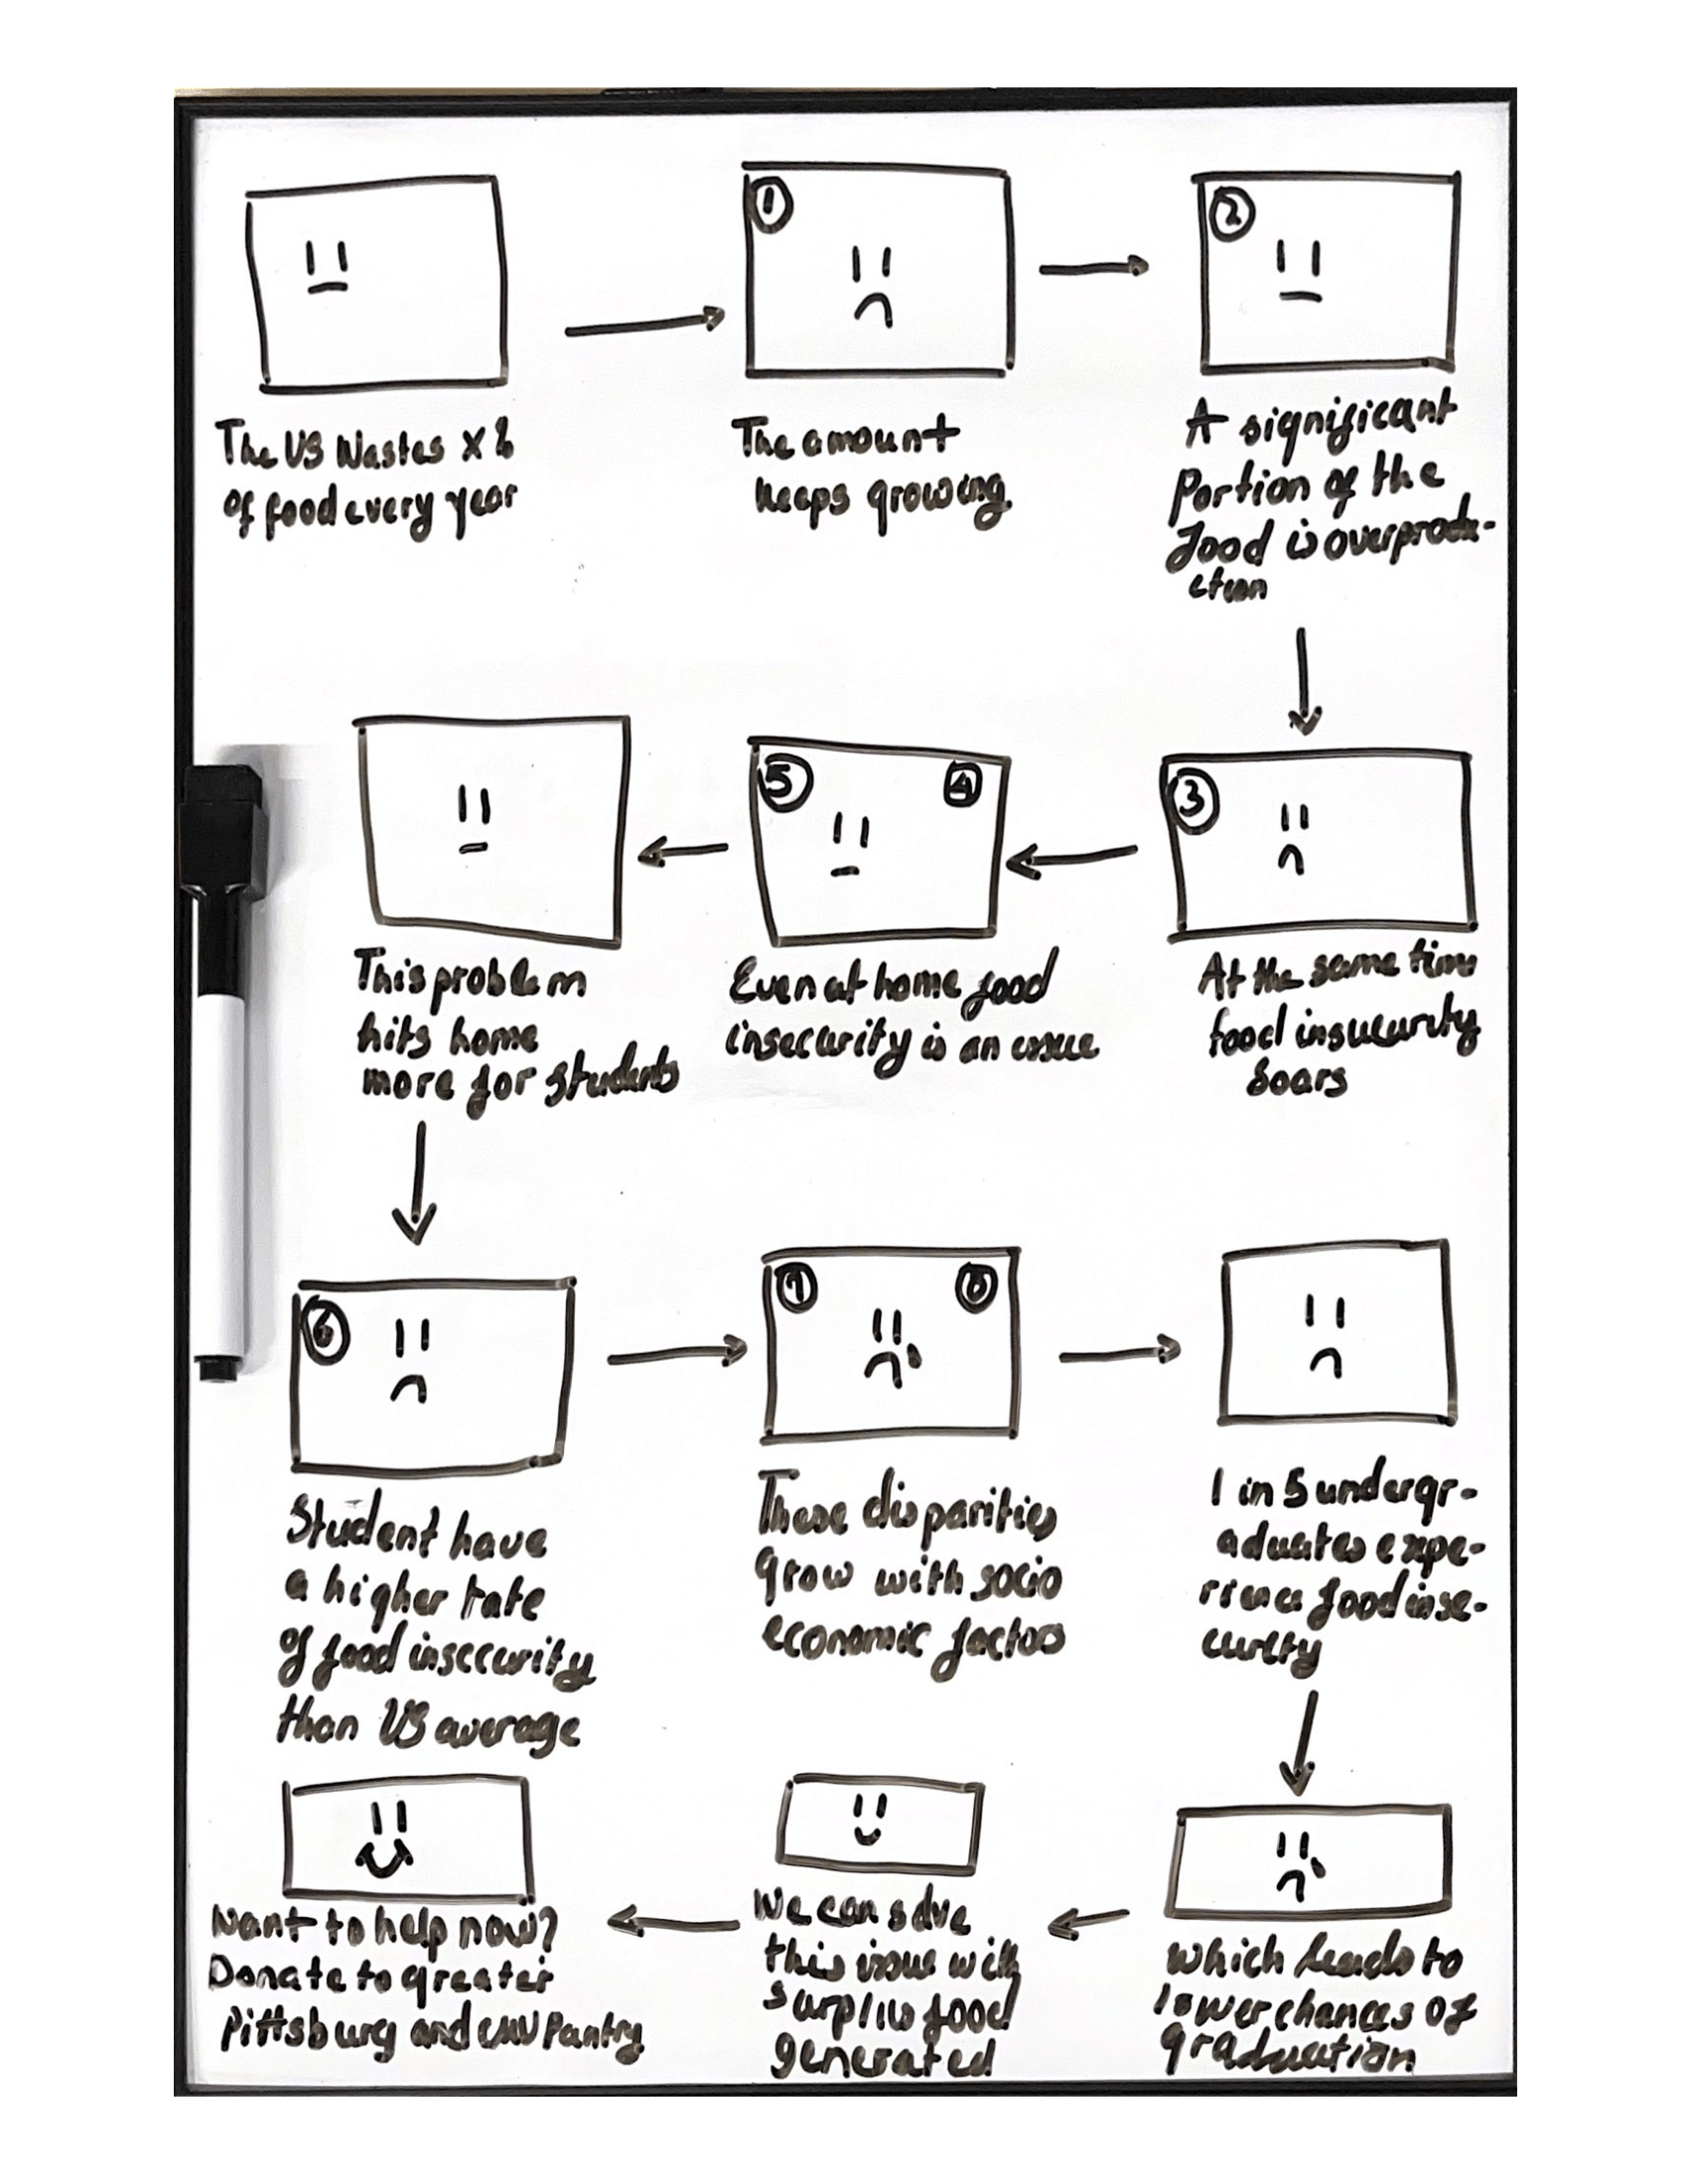
The story on food insecurity is highlighted in the storyboard below. It follows multiple arcs by informing the audience about a separate issue of food waste globally and in the US. It narrows down this perspective to only include overproduction or food surplus which eliminates other sources such as farm produce. The story then shifts to another global crisis of hunger or food insecurity. It also shows how food insecurity in the US affects people from different socioeconomic backgrounds differently. The story then narrows down to the main topic of the presentation on one group not popularly explored: college students. The story of food insecurity among college students starts by exploring major statistics that show food insecurity among college students is worse than in the general US population. It further discusses what groups of college students are most affected, calling out specific socioeconomic backgrounds as well. It ends on a somber note on hunger being a determining factor in success in graduation and completion of a degree. The story arc then ends on a happy note on how these two problems complement each other and how surplus food can be used to fill the food insecurity gap. It finally gives the audience some calls to action on how to help now which include getting involved with the greater Pittsburgh food bank.
Some Data Visualization Ideas
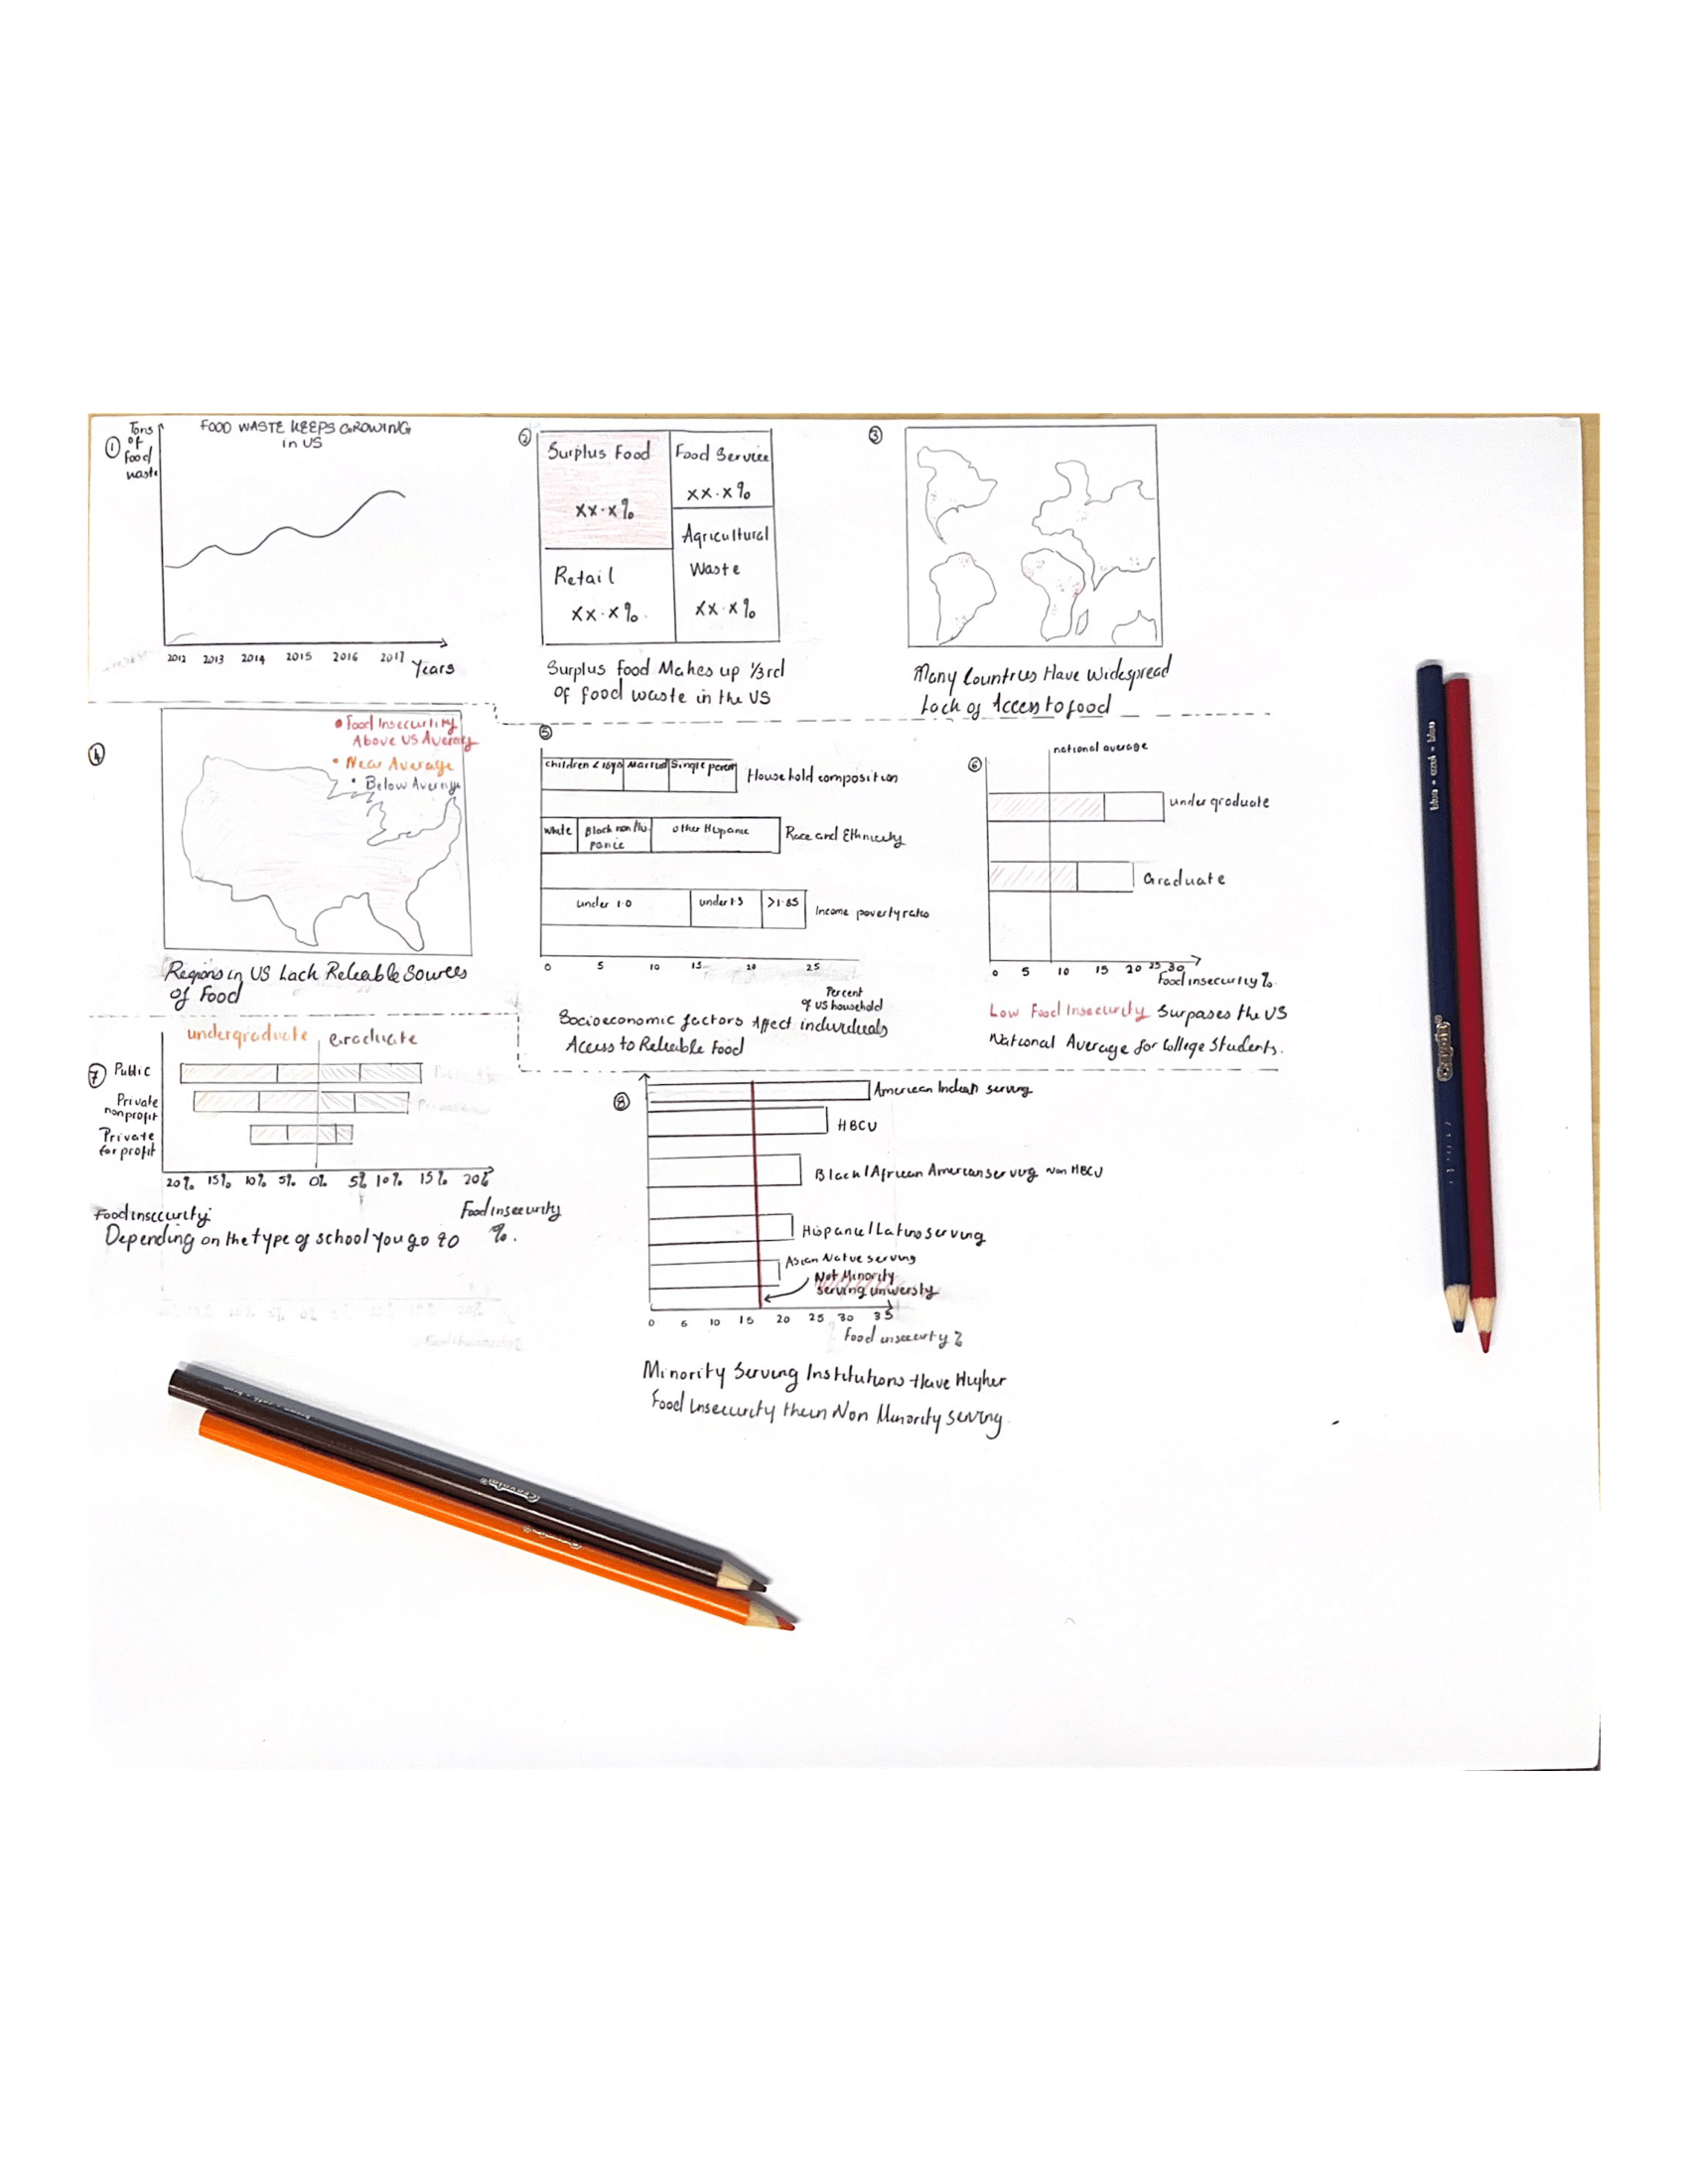
To better represent the story, the following visualizations will be created based on the part of the storyboard indicated by the numbers. Most of the visualizations work to show disparities among different classes of people such as in the case of socioeconomic factors with food insecurity in the US and within college students. Heat maps of the globe and the US are also used to show different areas where food insecurity exists to better put the problem in perspective. While the sketches are not completely representative of the data, they follow similar trends from the available datasets.
Method and Medium
Tableau will be used to create these visualizations to allow for data interactivity as many parts of whole data representations will do better with interactivity. The story will be created in shorthand where both the visualizations and the statistics will be used to complete the proposed storyboard.